Sharpen Your Knowledge with Qlik (QSBA2021) Certification Sample Questions
CertsTime has provided you with a sample question set to elevate your knowledge about the Qlik Sense Business Analyst Certification Exam - February 2021 Release exam. With these updated sample questions, you can become quite familiar with the difficulty level and format of the real QSBA2021 certification test. Try our sample Qlik Sense Business Analyst Certification Exam - February 2021 Release certification practice exam to get a feel for the real exam environment. Our sample practice exam gives you a sense of reality and an idea of the questions on the actual Qlik Sense certification exam.
Our sample questions are similar to the Real Qlik QSBA2021 exam questions. The premium Qlik Sense Business Analyst Certification Exam - February 2021 Release certification practice exam gives you a golden opportunity to evaluate and strengthen your preparation with real-time scenario-based questions. Plus, by practicing real-time scenario-based questions, you will run into a variety of challenges that will push you to enhance your knowledge and skills.
Qlik QSBA2021 Sample Questions:
Refer to the exhibit.
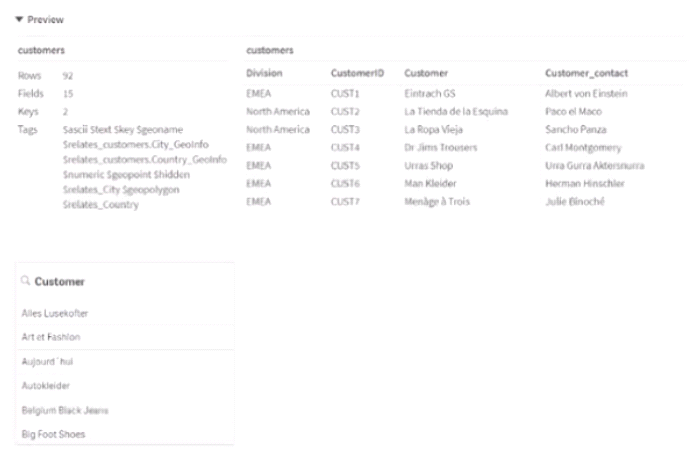
These tables have the same structure. The Customers information is as shown in the Data Model Viewer In a sheet called "Customer Analysis" there is a filter pane with Customers.
A business analyst s developing an app for the Sales department and loads the data about Customers from two files.
The business analyst wants the values to appear as they were loaded How should this issue be resolved?
A business analyst wants to create a dashboard for the Finance team to use The app must include four sheets one looking at the full dataset and three others focused on the regions APAC EMEA and AMERICAS each.
The team needs visualizations for
* Sales by Product in the past 6" months
* Cost of Sales on a map by Country
* Sales Cost and Margin by Month
Additionally the learn wants to dear fillers while navigating between sheets and enable chat in the hub Which features should be used?
How does the Qlik Associative Engine analyze data from one or more data sources?
A business analyst needs to develop a visualization that compares performances of every product the company sells and each product category. The CEO wants to highlight the worst- and best-performing products and categories in a meeting that beg/is in one hour Using a bar chart which two approaches should the business analyst use? (Select two.)
Refer to the exhibit.
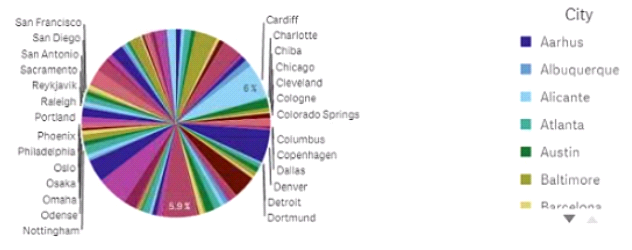
The business analyst needs to see now me same data wil appear m other chart types Which steps should the business analyst take to meet these requirements?

Note: If there is any error in our Qlik QSBA2021 certification exam sample questions, please update us via email at support@certstime.com.

 Try Before You Buy!