Sharpen Your Knowledge with Microsoft (70-778) Certification Sample Questions
CertsTime has provided you with a sample question set to elevate your knowledge about the Microsoft Analyzing and Visualizing Data with Microsoft Power BI exam. With these updated sample questions, you can become quite familiar with the difficulty level and format of the real 70-778 certification test. Try our sample Microsoft Analyzing and Visualizing Data with Microsoft Power BI certification practice exam to get a feel for the real exam environment. Our sample practice exam gives you a sense of reality and an idea of the questions on the actual Microsoft MCSA: BI Reporting certification exam.
Our sample questions are similar to the Real Microsoft 70-778 exam questions. The premium Microsoft Analyzing and Visualizing Data with Microsoft Power BI certification practice exam gives you a golden opportunity to evaluate and strengthen your preparation with real-time scenario-based questions. Plus, by practicing real-time scenario-based questions, you will run into a variety of challenges that will push you to enhance your knowledge and skills.
Microsoft 70-778 Sample Questions:
Note: This question is part of a series of questions that use the same scenario. For your convenience, the scenario is repeated in each question. Each question presents a different goal and answer choices, but the text of the scenario is the same in each question in this series.
You have a Microsoft SQL Server database that contains the following tables.
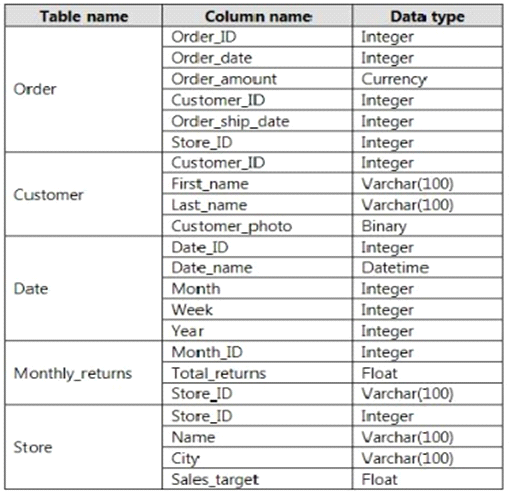
The following columns contain date information:
- Date[Month] in the mmyyyy format
- Date[Date_ID] in the ddmmyyyy format
- Date[Date_name] in the mm/dd/yyyy format
- Monthly_returns[Month_ID] in the mmyyyy format
The Order table contains more than one million rows.
The Store table has a relationship to the Monthly_returns table on the Store_ID column. This is the only relationship between the tables.
You plan to use Power BI Desktop to create an analytics solution for the data.
You need to create a relationship between the Monthly_returns table and Date[Date_ID].
What should you do before you create the relationship?
You have a Power BI model for sales data. You create a measure to calculate the year-to-date sales.
You need to compare the year-to-date sales with the previous year for the same time period.
Which DAX function should you use?
Note: This question is part of a series of questions that present the same scenario. Each question in the series contains a unique solution that might meet the stated goals. Some question sets might have more than one correct solution, while others might not have a correct solution.
After you answer a question in this section, you will NOT be able to return to it. As a result, these questions will not appear in the review screen.
Your company has 1,000 users in a Microsoft Office 365 subscription.
A Power BI administrator named Admin1 creates 20 dashboards and shares them with 50 users.
You discover that a user named User1 can access all the dashboards.
You need to prevent User1 from accessing all the dashboards.
Solution: From the Office 365 Admin center, you remove the Power BI license from User1.
Does this meet the goal?
You have a Power B1 model for sales data. You create a measure to calculate the year-to-date sales. You need to compare the year-to-date sales with the previous year for the same time period. Which DAX function should you use?
Note: This question is part of a series of questions that use the same scenario. For your convenience, the scenario is repeated in each question. Each question presents a different goal and answer choices, but the text of the scenario is the same in each question in this series.
Start of repeated scenario
You have a Microsoft SQL Server database that contains the following tables.
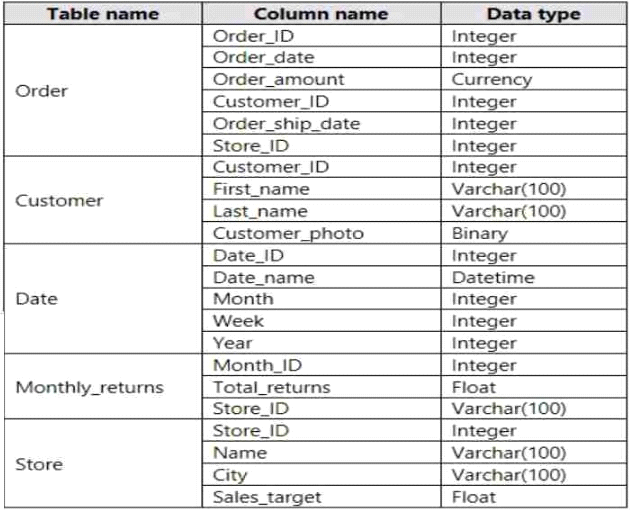
The following columns contain date information:
* Date[Month] in the mmyyyy format
* Date[Date_ID] in the ddmmyyyy format
* Date[Date_name] in the mm/dd/yyyy format
* Monthly_returns[Month_ID] in the mmyyyy format
The Order table contains more than one million rows.
The Store table has a relationship to the Monthly_returns table on the StoreJD column. This is the only relationship between the tables.
You plan to use Power B! Desktop to create an analytics solution for the data.
End of repeated scenario.
You need to create a chart that displays a sum of Order[Order_amount] by month for the Order_ship_date column and the Order_date column.
How should you model the data?

Note: If there is any error in our Microsoft 70-778 certification exam sample questions, please update us via email at support@certstime.com.

 Try Before You Buy!